Getting started
Gecos generates a color scheme by performing a Metropolis-Monte-Carlo optimization in color space. In short it means that the algorithm tries to assign colors to the symbols (e.g. amino acids), whose pairwise perceptual differences is proportional to the respective distances calculated from a substitution matrix.
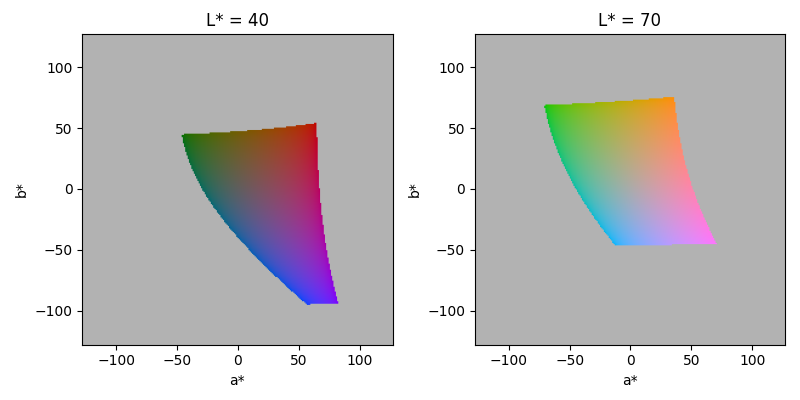
There are dozens of different color spaces with RGB probably being the most common one. Despite its popularity, the RGB color space does not do well when it comes to perceptual uniformity: Changing an RGB color value by a particular amount does not result in a visual difference of the same amount. Due to this issue Gecos uses the CIE L*a*b* color space instead, that behaves perceptually approximately uniform. The color space consists of three components:
L* - The lightness of the color.
0is completely black and100is completely white.a* - The green-red component. Green is in the negative direction, red is in the positive direction.
b* - The blue-yellow component. Blue is in the negative direction, yellow is in the positive direction.
While values for a* and b* are not limited in either direction, only a small space is displayable and hence can be converted into RGB colors. Consequently the optimization process is also restricted to the displayable subspace. The following plots show the displayable a*b* space at two different L* levels. The gray area consists of L*a*b* values that cannot be converted into RGB space.
Installation
In order to use Gecos you need to have Python (at least 3.6) installed. Furthermore, the following Python packages are required:
biotite
numpy
matplotlib
scikit-image
If these prerequisites are met, Gecos is simply installed via
$ pip install gecos
Alternatively, Gecos can be installed via Conda:
$ conda install -c conda-forge gecos
Basic usage
The most simple invocation is simply
$ gecos
By default Gecos uses the BLOSUM62 matrix to generate a color scheme, which
is printed to console.
Alternatively, You can save the color scheme into a file via the -f option.
The color scheme is printed in a Biotite compatible JSON format and will
look something like this:
{
    "name": "scheme",
    "alphabet": ["A","C","D","E","F","G","H","I","K","L"
                 "M","N","P","Q","R","S","T","V","W","Y"],
    "colors": {
        "A": "#7c7b8b",
        "C": "#17ebd9",
        "D": "#740365",
        "E": "#992651",
        "F": "#f3df8c",
        "G": "#140a1a",
        "H": "#b41308",
        "I": "#e8eafe",
        "K": "#fe83aa",
        "L": "#f0eee6",
        "M": "#fcdbce",
        "N": "#d0388b",
        "P": "#ba82fd",
        "Q": "#873429",
        "R": "#fe7878",
        "S": "#744759",
        "T": "#4c5e53",
        "V": "#afcbe0",
        "W": "#d5e70b",
        "Y": "#aa7e00"
    }
}
The value of "name" is obviously the given name of the color scheme.
It can be adjusted with the --name option.
The "alphabet" maps to a list of symbols comprised by the alphabet the
scheme is intended for.
The most important field is "colors":
It maps to a dictionary, where a color is assigned to each symbol of the
alphabet.
Even though Gecos assigns a color to all symbols in "alphabet",
the format allows that "colors" assigns colors only to a subset of the
symbols in alphabet.
Note
Although the format is compliant with the Biotite color scheme format,
the Biotite amino acid alphabet contains additional symbols for the
ambiguous amino acids and the stop codon.
Hence incorporating a Gecos JSON file into the Biotite source code
requires that the symbols "B", "Z", "X" and "*" are appended
at the end of the "alphabet" value.
Editing "colors" is not necessary.
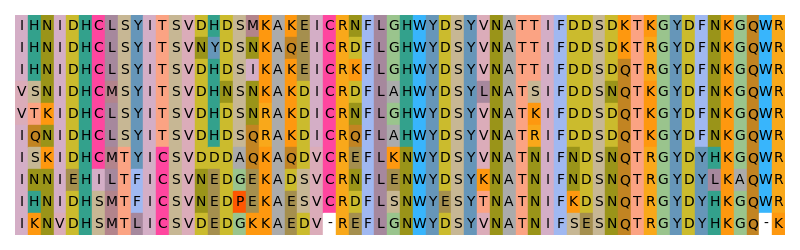
As the color space was not restricted in any way, the generated color scheme contains the whole lightness range - from pitch-black to pure white. Alignments visualized with this color scheme look accordingly:
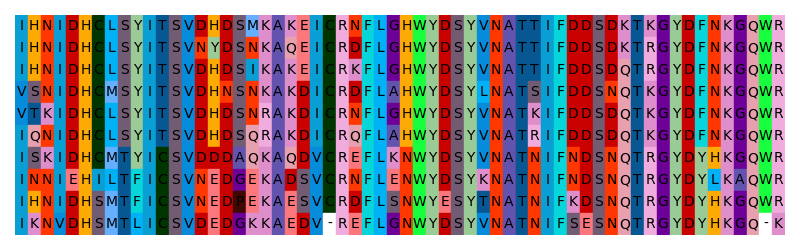
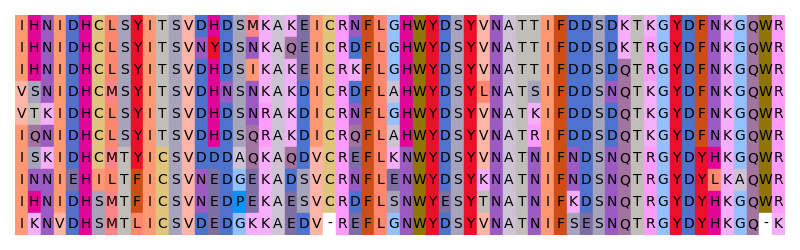
Although this scheme has a high contrast and the color differences are well aligned with the substitution matrix, such a wide lightness range is seldom intended. To constrain the lightness range, you can give Gecos a minimum and a maximum lightness level:
$ gecos --lmin 60 --lmax 75 -f a_color_scheme.json

However, the minimum and the maximum lightness should not be too close, lest the contrast will be quite low.
Color constraints
The a* and b* components can be restrained in the same way, to create
a color scheme that is shifted into a certain hue.
This can, for example, be used to create a color scheme for red-green deficient
people.
For this purpose the green region will be removed, i.e. a* starts at
0.
In order to compensate for the lost contrast, the lightness range is increased:
$ gecos --amin 0 --lmin 50 --lmax 80 -f no_green_scheme.json
Likewise the saturation range can be set.
The saturation is the euclidean distance of the a*b* components to
gray (0, 0):
$ gecos --smin 30 --lmin 55 --lmax 75 -f saturated_scheme.json
Last but not least, you can constrain a symbol to a specfic L*a*b* color
via the --constraint or -c option.
The optimization will not change the color of constrained symbols.
In the following example, we want alanine to be gray and tryptophane to be
blue, both with a lightness of 70:
$ gecos -c A 70 0 0 -c W 70 -10 -45 --lmin 60 --lmax 75 -f constrained_scheme.json
Adjusting the contrast
Gecos’ optimization process contains an additional score that penalizes
low contrast color conformations, i.e. average low distances between the
symbols.
This behavior can be customized by setting the --contrast option.
When the value is 0, low contrast schemes are not penalized.
The higher the value, the more the symbols are driven to the edges of the
color space.
A bit of experimentation is necessary to find an optimal value for this
option.
The following example creates a high contrast color scheme:
$ gecos --contrast 2000 --lmin 60 --lmax 75 -f high_contrast_scheme.json
Warning
Use the --contrast parameter with caution.
Increasing the contrast parameter also means, that the substitution matrix
is weighted less strongly.
Consequently, although a high contrast color scheme may look appealing,
it also may not represent the similarity of symbols very well.
Color space and scheme preview
You do not need to create an alignment yourself in order to evaluate a newly created color scheme. Gecos provides some visualization capabilities by itself, so you can directly discard a color scheme you do not like.
At first, you can output your selected color space with the --show-space
option.
The additional --dry-run terminates the program after the color space
has been displayed:
$ gecos --show-space --dry-run --smin 30 --lmin 60 --lmax 70
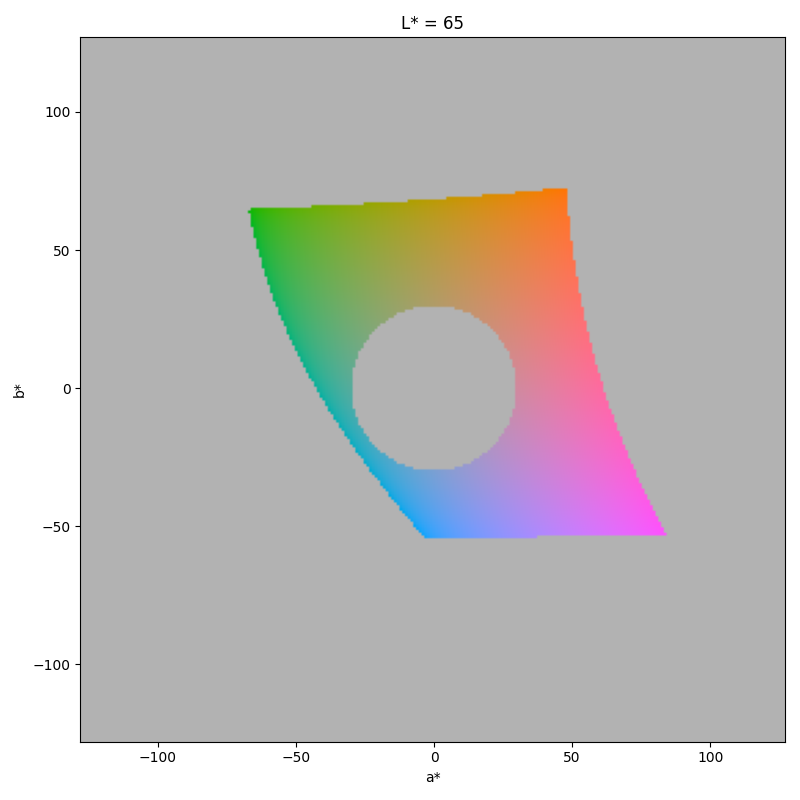
The plot is a 2D projection of the color space at a fixed lightness.
The lightness value in the plot is the average of the --lmin and the
--lmax value.
The displayed lightness value can be customized with the --lightness
option.
The hole in the center of the plot is causes by the saturation constraint.
The --show-scheme option shows the symbol conformation in color space
after the optimization.
Again the plot is a 2D projection at a fixed lightness.
The white area shows the allowed color space at the given lightness:
$ gecos --show-scheme --smin 30 --lmin 60 --lmax 70
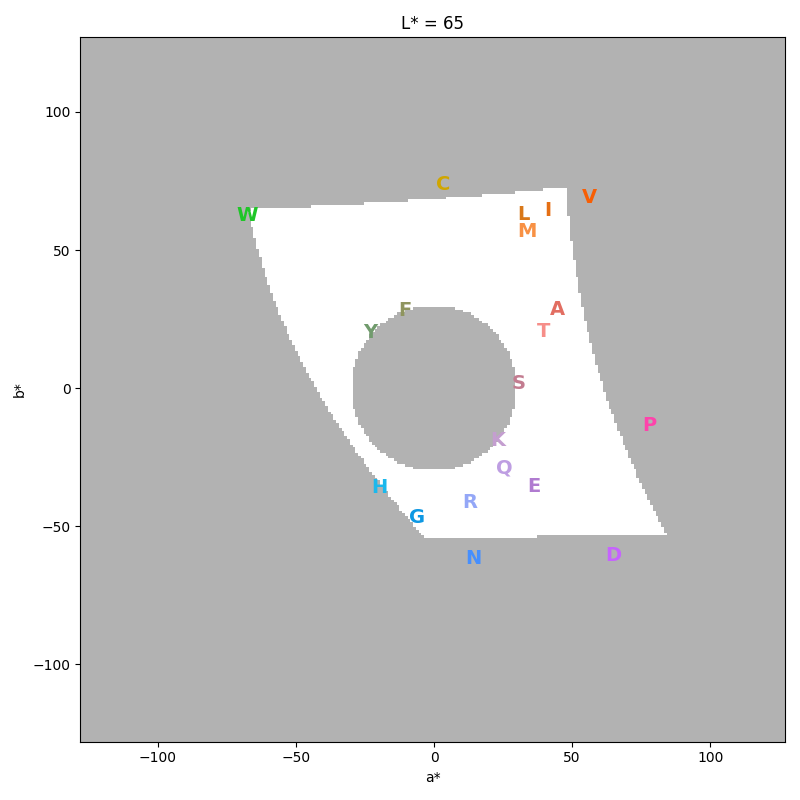
Some symbols might seem to be outside of the allowed space, but remember that the white area is only the allowed space at the displayed lightness.
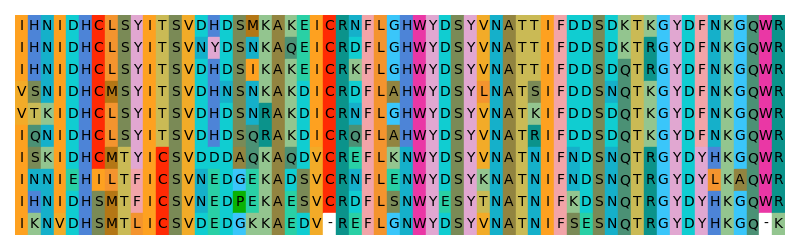
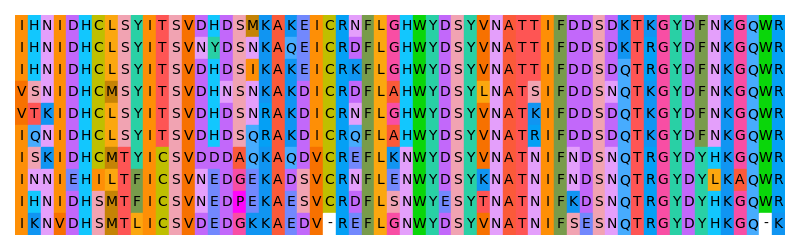
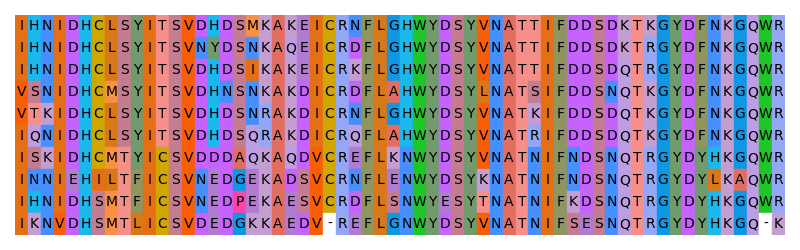
The --show-example options shows an example multiple protein
sequence alignment with the color scheme.
$ gecos --show-example --smin 30 --lmin 60 --lmax 70
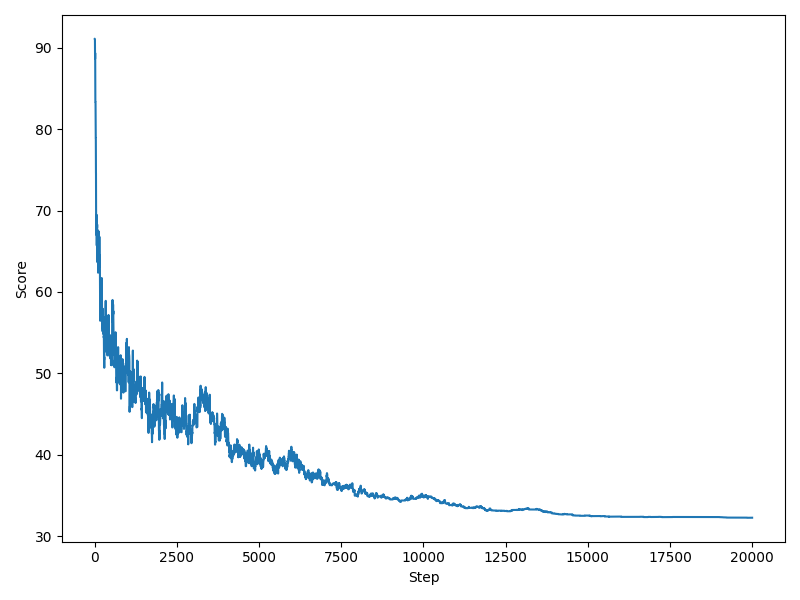
Finally, you can plot the progression of the score, Gecos tries to minimize, during the course of the optimization. Note that a low score means a better color conformation.
$ gecos --show-score --smin 30 --lmin 60 --lmax 70
Custom matrices and alphabets
While the default substitution matrix Gecos uses is BLOSUM62, you can also
use a custom substitution matrix.
Either a valid NCBI substitution matrix name (e.g. PAM250) or a custom matrix
file in NCBI format can be supplied to the --matrix/-m option.
Likewise, it is possible to generate a color scheme for a different alphabet
than the default amino acid alphabet, by setting the --alphabet/-a
option.
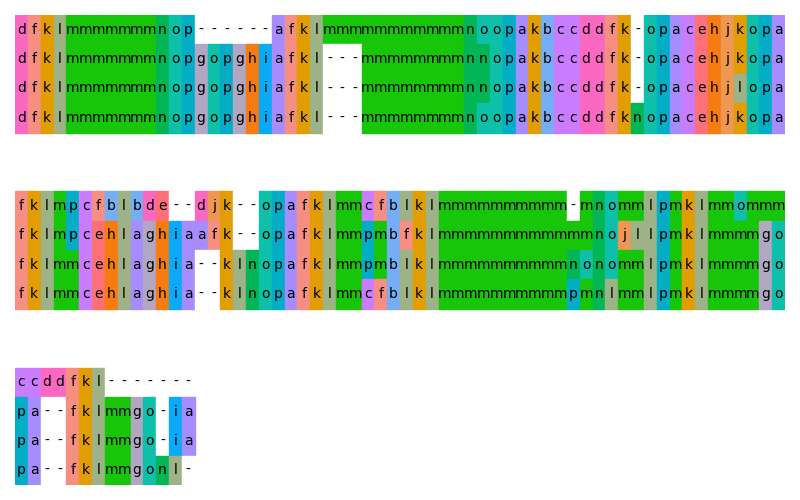
In order to demonstrate this, the following example will generate a color scheme
for the protein blocks (PB) alphabet
(de Brevern et al., 2000).
The Protein blocks alphabet consists of 16 symbols, from a to p,
where each one represents another protein backbone conformation.
In a nutshell, PBs can be used to encode a molecular 3D structure into a
sequence.
In order to generate a color scheme you need to tell Gecos to use the
PB alphabet and the PB substitution matrix (stored in the file PB.mat):
$ gecos -a abcdefghijklmnop -m PB.mat --contrast 300 --lmin 65 --lmax 70 -f pb_scheme.json
Citation
If you use Gecos in a scientific publication, please cite:
P. Kunzmann, B. E. Mayer, K. Hamacher, “Substitution matrix based color schemes for sequence alignment visualization,” BMC Bioinformatics, vol. 21, pp. 209, 2020. doi: 10.1186/s12859-020-3526-6
